

July 23rd, 2011 PST
Posted by pftq
Posted by pftq
3. Reading a Stock
First off, there are plenty of other things not covered below to watch for. You can probably read about them and the below indicators in more depth through books on technical analysis, candlestick patterns, etc. Over time, however, I've found I relied most heavily on a few select indicators, so that will be my focus.
When you open up Command Center, the most useful thing is obviously the Chart. Try to match the settings in the screenshot below. You can change the Time Period and Frequency to match how far ahead you want to predict. For example: daily = next couple days, 30-min = next couple 30 minutes, etc.
The line type can be changed between line and candlesticks; I use both equally. A candlestick basically lets you see the max/min price of that day as well (the body being the open/close). RSI is also very useful for minute-to-minute chart reading, and I usually switch it with Slow-Sto to avoid making the chart too crowded with another indicator added.
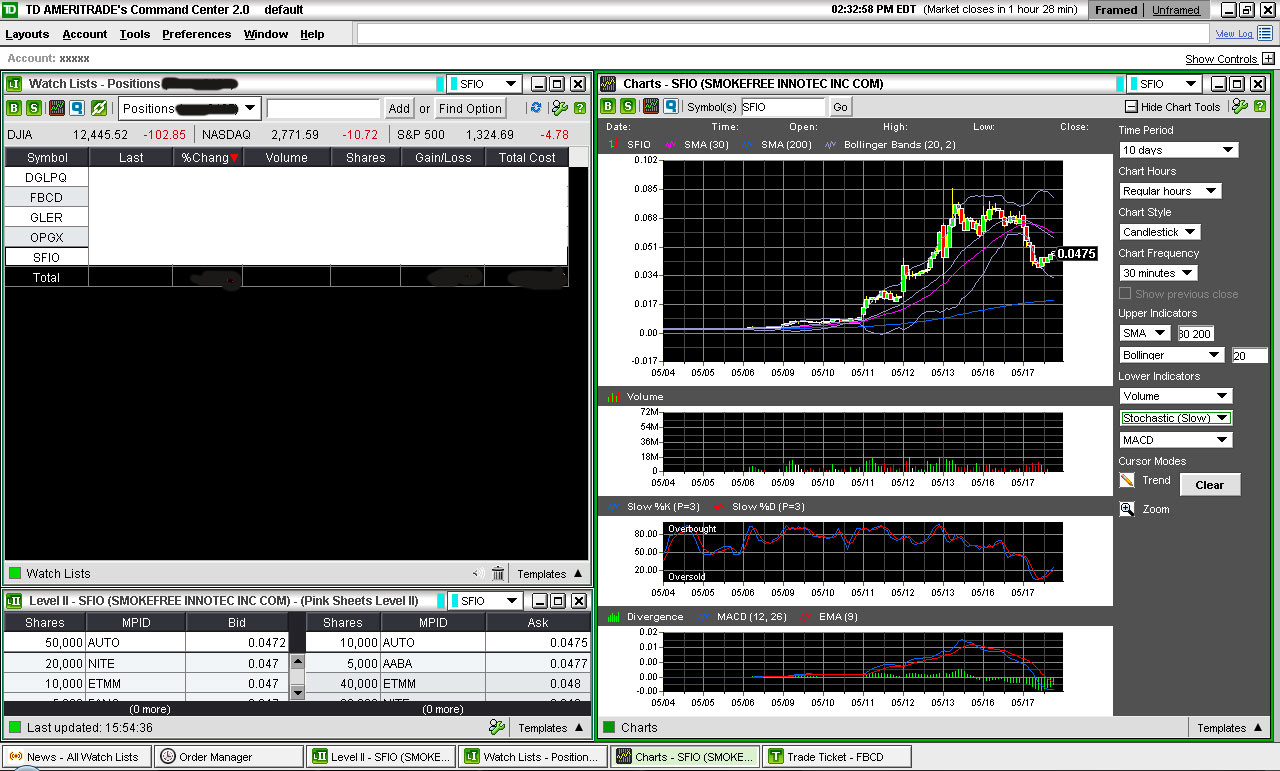
(Ironically, the stock shown above is an example of a *bad* one, which has broken support.)
Here's a quick guide:
- STO lines crossing upwards = Going up in the very next cycle (relative to the chart frequency, ex: daily = next few days)
- MACD lines crossing upwards = Overall go up in the next few cycles. For example, STO might say it'll go up in the immediate cycle but it might only go up for a tiny bit before dying if the MACD is pointed downwards.
- RSI > 70 = Too high, should come down soon, but only enough that RSI is back under 70, not that the stock itself should start plummeting (although it can).
- Volume = how many trades are being done. More = stronger movement (up or down). A stock is useless even if it goes 1000% if there's only 1 guy buying it. When a stock is moving up, you want it to do so on high volume. If there is high volume but no price movement, it is also not a good sign, as that has to make you wonder how much more buying it'd take to finally move the price. This is arguably the most important indicator; it can basically substantiate or de-emphasize any price movement.
Trendlines
Trendlines are covered in basically any tech analysis book, but I just want to re-emphasize how important they are. Draw them. Draw them across the bottoms when a stock is going up to figure out where the support is, and draw them across the tops when a stock is going down to see where the resistance is. The time frame across which you draw them is what time frame they will be good for predicting.
The stock price is constantly fluctuating, but you want to know when the movement is just "normal" fluctuation on the way up or something more drastic. A support line is basically where the price should never fall below, if the stock is following that current trend. A resistance line is where the price should never go above, again if the stock is following the current trend. If the stock price crosses significantly below a support line or above a resistance line (called a "break"), it means the stock no longer follows that immediate trendline.
When a trendline is broken, enlarge the time frame to see more of the graph and draw an additional trendline on the longer time span to see where the stock price might stop next. You're basically now counting on the longer term trendline once the shorter term is broken. Conceptually, it makes sense: A trendline that lasts only a few minutes will likely be broken within minutes while the longer ones (days, months, years) will be stronger.
Another thing to note is that when trendlines break, the old trendline now switches from support to resistance or resistance to support. For example, if it took a lot of buying power to break past a resistance line at $50, it will also take a lot of selling to bring it back under.
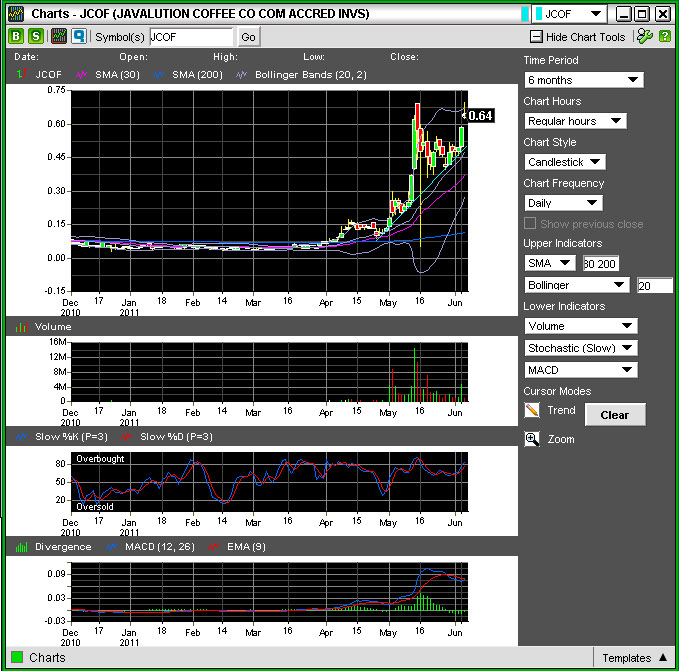
Below is an image of JCOF during the Spring of 2011. You can see that drawing a trendline across the bottoms for the month would have clearly told you when to buy the stock so as to not get in too high (and breaking of the support line would mean to get out as the stock might continue to go lower in that time frame).
You can see the below image for how even across a couple days can be meaningful:
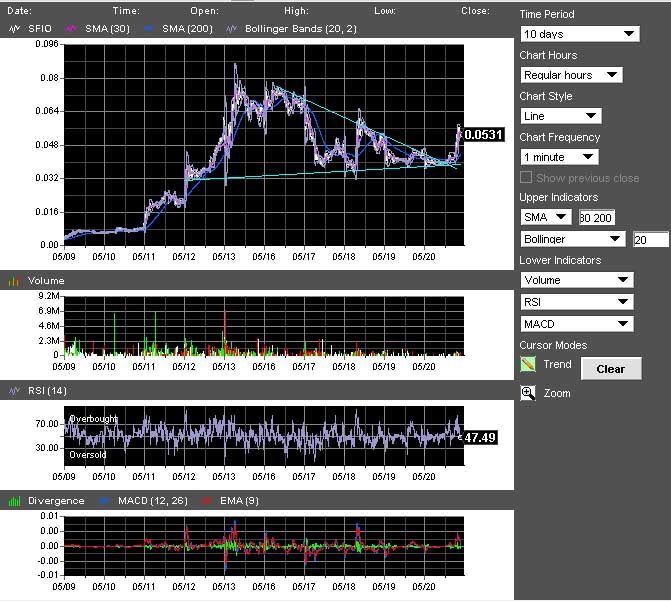
The crossing of the support (bottom) and resistance (upper) meant that that point was most important to watch to see if it would break upwards or downwards (one of the lines had to be wrong).
And below is an image of LVLT in 2011, using a combination of trendlines and STO crosses. LVLT, in my opinion, is probably what you want most stocks you buy to look like - that is, it resembles a stair-like pattern.

You can see that each time the green, short-term support lines broke, the chart falls back to using the blue longer-term trendline. Each time the red, short-term resistance lines broke, it usually meant the stock was done coming back down.
It seems silly to draw lines that only work if the stock is following the line, but that's the idea. If a stock is moving up and bouncing off its support line during each fluctuation, you can determine when the stock has finished moving up if at a certain pullback, it falls below the support line. Likewise for a stock currently headed downwards - it is probably done heading downwards if it suddenly crosses above its resistance line. Think of it as a rule of thumb for making consistent decisions on whether a stock is heading up or down.
Below is a chart of SPY showing if you traded just trendline breaks over the last 20 years using Tech Trader:
Closing Words
The most important part (and a reason so many lose in stocks) is to be consistent and have discipline. Don't make a stretch and try to convince yourself of something that the chart doesn't show. If a stock is good, the chart itself will be convincing.
Furthermore, don't try to predict what indicators might do - the indicators themselves are supposed to do the predicting. Anything else that isn't listed above is ambiguous so don't try to jump the gun by saying it's "about to cross" because it might not. It's when you try to go against the indicators (or jump the gun and guess) to get the extra percentage that you risk a lot.
Also make sure you remember what time frame you are reading a chart for. Some of the mistakes I've regretted most, for example, were using a 30-min frequency chart and not getting out of the stock in the next couple hours (2-3 x 30-min) when the indicators were still good. If you are reading a chart for 30-min, it's only good for the next several 30-min periods (hours). If you reading a chart for day-to-day, it is only good for the next several days.
And last but not least, not all stocks will be as "readable" as others. Stay away from those that are less predictable (constantly breaking trendlines, etc). There are plenty of readable stocks out there - why take the extra risk?
When you open up Command Center, the most useful thing is obviously the Chart. Try to match the settings in the screenshot below. You can change the Time Period and Frequency to match how far ahead you want to predict. For example: daily = next couple days, 30-min = next couple 30 minutes, etc.
The line type can be changed between line and candlesticks; I use both equally. A candlestick basically lets you see the max/min price of that day as well (the body being the open/close). RSI is also very useful for minute-to-minute chart reading, and I usually switch it with Slow-Sto to avoid making the chart too crowded with another indicator added.
(Ironically, the stock shown above is an example of a *bad* one, which has broken support.)
Here's a quick guide:
- STO lines crossing upwards = Going up in the very next cycle (relative to the chart frequency, ex: daily = next few days)
- MACD lines crossing upwards = Overall go up in the next few cycles. For example, STO might say it'll go up in the immediate cycle but it might only go up for a tiny bit before dying if the MACD is pointed downwards.
- RSI > 70 = Too high, should come down soon, but only enough that RSI is back under 70, not that the stock itself should start plummeting (although it can).
- Volume = how many trades are being done. More = stronger movement (up or down). A stock is useless even if it goes 1000% if there's only 1 guy buying it. When a stock is moving up, you want it to do so on high volume. If there is high volume but no price movement, it is also not a good sign, as that has to make you wonder how much more buying it'd take to finally move the price. This is arguably the most important indicator; it can basically substantiate or de-emphasize any price movement.
Trendlines
Trendlines are covered in basically any tech analysis book, but I just want to re-emphasize how important they are. Draw them. Draw them across the bottoms when a stock is going up to figure out where the support is, and draw them across the tops when a stock is going down to see where the resistance is. The time frame across which you draw them is what time frame they will be good for predicting.
The stock price is constantly fluctuating, but you want to know when the movement is just "normal" fluctuation on the way up or something more drastic. A support line is basically where the price should never fall below, if the stock is following that current trend. A resistance line is where the price should never go above, again if the stock is following the current trend. If the stock price crosses significantly below a support line or above a resistance line (called a "break"), it means the stock no longer follows that immediate trendline.
When a trendline is broken, enlarge the time frame to see more of the graph and draw an additional trendline on the longer time span to see where the stock price might stop next. You're basically now counting on the longer term trendline once the shorter term is broken. Conceptually, it makes sense: A trendline that lasts only a few minutes will likely be broken within minutes while the longer ones (days, months, years) will be stronger.
Another thing to note is that when trendlines break, the old trendline now switches from support to resistance or resistance to support. For example, if it took a lot of buying power to break past a resistance line at $50, it will also take a lot of selling to bring it back under.
Below is an image of JCOF during the Spring of 2011. You can see that drawing a trendline across the bottoms for the month would have clearly told you when to buy the stock so as to not get in too high (and breaking of the support line would mean to get out as the stock might continue to go lower in that time frame).
You can see the below image for how even across a couple days can be meaningful:
The crossing of the support (bottom) and resistance (upper) meant that that point was most important to watch to see if it would break upwards or downwards (one of the lines had to be wrong).
And below is an image of LVLT in 2011, using a combination of trendlines and STO crosses. LVLT, in my opinion, is probably what you want most stocks you buy to look like - that is, it resembles a stair-like pattern.
You can see that each time the green, short-term support lines broke, the chart falls back to using the blue longer-term trendline. Each time the red, short-term resistance lines broke, it usually meant the stock was done coming back down.
It seems silly to draw lines that only work if the stock is following the line, but that's the idea. If a stock is moving up and bouncing off its support line during each fluctuation, you can determine when the stock has finished moving up if at a certain pullback, it falls below the support line. Likewise for a stock currently headed downwards - it is probably done heading downwards if it suddenly crosses above its resistance line. Think of it as a rule of thumb for making consistent decisions on whether a stock is heading up or down.
Below is a chart of SPY showing if you traded just trendline breaks over the last 20 years using Tech Trader:
The most important part (and a reason so many lose in stocks) is to be consistent and have discipline. Don't make a stretch and try to convince yourself of something that the chart doesn't show. If a stock is good, the chart itself will be convincing.
Furthermore, don't try to predict what indicators might do - the indicators themselves are supposed to do the predicting. Anything else that isn't listed above is ambiguous so don't try to jump the gun by saying it's "about to cross" because it might not. It's when you try to go against the indicators (or jump the gun and guess) to get the extra percentage that you risk a lot.
Also make sure you remember what time frame you are reading a chart for. Some of the mistakes I've regretted most, for example, were using a 30-min frequency chart and not getting out of the stock in the next couple hours (2-3 x 30-min) when the indicators were still good. If you are reading a chart for 30-min, it's only good for the next several 30-min periods (hours). If you reading a chart for day-to-day, it is only good for the next several days.
And last but not least, not all stocks will be as "readable" as others. Stay away from those that are less predictable (constantly breaking trendlines, etc). There are plenty of readable stocks out there - why take the extra risk?
9244 unique view(s)


Jan-19-2014, 09:08pm
jlaznram says...