

December 2nd, 2011 PST
Posted by pftq
Posted by pftq
6. Options, Straddles
Options magnify both your gains and losses, but your losses are floored at 100% (opposite, as usual, if you're shorting). However, you're now betting not just on the stock price but on people's bias/perception on the stock as well. That is, even if the stock goes up, your options might actually fall if the expected potential movement of the stock goes down from when you bought it (you weren't the only one expecting the stock to go up that amount). There's a lot you can do with this; what I mainly do and what I'll cover here is making a directional bet on the underlying stock.
The key for me with options is to bet small. Since your gains are magnified, you make a lot when you're right. When you're wrong, you lose a huge percentage (basically everything) but the actual dollar amount is small if you only put little to begin with. Unless you're very certain or are going for some kind of straddle/strangle, try to buy contracts that expire several months down the line or more, to minimize decay.
The price of an option to me is mainly made up of three components, which I consider expiration value, time value, and uncertainty (volatility) value. The terms are not necessarily correct, just the easiest way for me to think of them from my own experience (I've never read any books on this). The expiration value is the value of an option on expiration day and the minimum value of the option after the decay of the other two. It is the difference between the strike and the actual stock price; if it's a call, your strike must be lower and vice versa for a put. The other two, time and uncertainty, are additions on top of the expiration value. It is the reason why a call with the strike at the current price is not zero. The time value is based the number of days left before expiration. The uncertainty value is the component that can vary; it is the part where people's expectations play in. If people expect a stock to go down, the puts might be much more expensive than the calls for the same difference from strike (put/call skew). This is often the case during market sell offs or going into major news events.
The price of an option on expiration day will always be the difference between the stock price and strike, so if you pay more than that difference, it means you are betting that the stock will move enough by expiration day to increase the difference (options price). For example, if you pay $1 for a call at strike $10 for a stock that's already at $10, it means you're betting the stock will be at least $11 by expiration. $11 is just your break-even price, since the difference between stock and strike (the ultimate price on expiration day) will be $1 , which is what you paid. You can also interpret the current price of an option to be what other people think the stock might go to. A call that has a strike above the stock price is out of the money while below the stock price is in the money; the opposite goes for puts where you're betting the stock goes down.
For me, as I'm a directional trader mainly basing decisions off the underlying stock, I generally only trade options when the break-even price for an option is well within my target price for the stock. It lets me not worry about decay because I can expect the minimum value of the option (assuming my target for the stock is right) will be profitable. If my stock target is hit early enough that there's still extra value from time or uncertainty, then that's just an added bonus.
Picking Strikes, Expected Gains, and Prices
For myself, I have my own way of picking what strikes I want. For longer-term trades, I try to stay near the money to minimize time decay, but if I am expecting a large move on the stock in a couple days, I can gauge what strikes would give me the best return for that move in the stock. Generally, the more out of the money the option is, the more leverage you get over the return. To figure out how much, I look at the next strike over that's deeper in the money. If the next strike over is $1 away and 50% more, then I'd expect a $1 move in the stock to lead to about a 50% move in the options at the strike I'm looking at. So if I have a price target at $11 with the stock currently at $10, I would try to find the calls that have the most percentage difference between the next strike over without being crazy out of the money.
For what price to execute at, what I essentially do is look at other contracts to determine what the cheapest extrinsic value across the contracts is. Extrinsic value is the extra price above the difference between strike and stock price (the intrinsic value). If the extrinsic value on a contract is much higher than other contracts, you're likely over-paying and want to bid lower. The opposite goes for if you're selling.
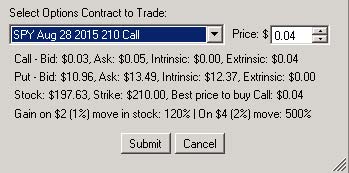
Updated 2015: All of this same logic I've built into my Tech Trader system which has been automatically picking out the best strikes for me on numerous trades as well as how to price your order. You can see that it automatically looks down the option chain to estimate the gain on the current contract if certain moves happen in the stock (excluding time decay of course; this is for short-term trades). It then uses intrinsic and extrinsic values across surrounding contracts to decide how to price the current contract.
Options Straddles (ex. Volatile Markets During 2011)
This is another approach you can take if the markets are volatile or you know for sure of a pending event for a stock. What you can do is buy both calls and puts (equal dollar amounts) to just bet the stock will move a lot in either direction. This is called a straddle. Basically you can lose 100% on one side but you count on the other going >100%. The breakeven price when you do a straddle would be the sum of the two breakeven prices for each the calls and the puts.
For 2011, I mainly did this on SPY and FAS, depending on where I think the focus will be (read the news); SPY is general market while FAS leans toward financials. The market at that time would often jump several percent overnight up or down based on any hint of good or bad news on Greece. The same occurred in later years for Fed announcements 2013-2014 and then going into OPEC's announcement on oil in Nov. 2014. You'd think these events would be priced into the options, but for whatever reason, the events often exceed the market's expectations.
You can also try combining this with technicals to find inflection points (bollinger band pinches, etc), but you have to pay attention to ongoing news/events to have a sense of whether it's a good time for this. This is an example of a strategy I was using in 2011 when everyone thought Greece would drag the world into financial crisis:
- Check 30-min bollinger bands for pinch to see what days will gap. (last few weeks, it's pinched mid/end day and then gapped that night).
- Buy equal positions (in dollars, not contracts) on ITM calls/puts at end of day because decay eats up a lot during sideways movement intraday.
- Sell gaining position next morning, often at about 10:30-10:45am EST. After 11am EST, market usually retraces or trades sideways until ~3pm EST, so this can be an opp to let go of the losing side of the straddle.
(Notice the bollinger bands pinch on exactly the days there will be gaps, whether up or down.)
Reading Options Volume
Besides just using options to leverage directional trades on the stock, you can use options activity as another layer of analysis to determine where the underlying stock is going. Some call this reading options volume or orderflow. I learned this primarily while being part of the community of traders at HotStockMarket.com in 2009-2012. One member o7 (aka OptionRunners or Karim) was particularly good at this technique; a big thanks for his help at the time.
The key is to filter out options trades that are just hedges or part of a larger spread, straddle, or other combination, as well as only pay attention to actual opening of calls or puts (as opposed to selling). You can do this manually by watching the options chain for increases in volume coupled with upticks in price; usually trades that force open interest to increase are a good sign. You can also subscribe to services like LiveVol which will have a live database available to query and drill down on particular trades with.
Because of how many more ways you can trade the underlying stock from, it is much more difficult to read the stock this way and takes a lot of practice (as well as keeping in tune with what traders are generally doing around options). For those starting out, I highly recommend following a few traders who do this (such as OptionRunners which you can Google) to get a feel for it.
The key for me with options is to bet small. Since your gains are magnified, you make a lot when you're right. When you're wrong, you lose a huge percentage (basically everything) but the actual dollar amount is small if you only put little to begin with. Unless you're very certain or are going for some kind of straddle/strangle, try to buy contracts that expire several months down the line or more, to minimize decay.
The price of an option to me is mainly made up of three components, which I consider expiration value, time value, and uncertainty (volatility) value. The terms are not necessarily correct, just the easiest way for me to think of them from my own experience (I've never read any books on this). The expiration value is the value of an option on expiration day and the minimum value of the option after the decay of the other two. It is the difference between the strike and the actual stock price; if it's a call, your strike must be lower and vice versa for a put. The other two, time and uncertainty, are additions on top of the expiration value. It is the reason why a call with the strike at the current price is not zero. The time value is based the number of days left before expiration. The uncertainty value is the component that can vary; it is the part where people's expectations play in. If people expect a stock to go down, the puts might be much more expensive than the calls for the same difference from strike (put/call skew). This is often the case during market sell offs or going into major news events.
The price of an option on expiration day will always be the difference between the stock price and strike, so if you pay more than that difference, it means you are betting that the stock will move enough by expiration day to increase the difference (options price). For example, if you pay $1 for a call at strike $10 for a stock that's already at $10, it means you're betting the stock will be at least $11 by expiration. $11 is just your break-even price, since the difference between stock and strike (the ultimate price on expiration day) will be $1 , which is what you paid. You can also interpret the current price of an option to be what other people think the stock might go to. A call that has a strike above the stock price is out of the money while below the stock price is in the money; the opposite goes for puts where you're betting the stock goes down.
In other words, the formula for determining your break-even price on expiration day is:
Breakeven Price of Call = option price + strike
Breakeven Price of Put = strike - option price
The amount you're betting the stock to move is:
Expected move in stock = breakeven price - stock price
Breakeven Price of Call = option price + strike
Breakeven Price of Put = strike - option price
The amount you're betting the stock to move is:
Expected move in stock = breakeven price - stock price
For me, as I'm a directional trader mainly basing decisions off the underlying stock, I generally only trade options when the break-even price for an option is well within my target price for the stock. It lets me not worry about decay because I can expect the minimum value of the option (assuming my target for the stock is right) will be profitable. If my stock target is hit early enough that there's still extra value from time or uncertainty, then that's just an added bonus.
Picking Strikes, Expected Gains, and Prices
For myself, I have my own way of picking what strikes I want. For longer-term trades, I try to stay near the money to minimize time decay, but if I am expecting a large move on the stock in a couple days, I can gauge what strikes would give me the best return for that move in the stock. Generally, the more out of the money the option is, the more leverage you get over the return. To figure out how much, I look at the next strike over that's deeper in the money. If the next strike over is $1 away and 50% more, then I'd expect a $1 move in the stock to lead to about a 50% move in the options at the strike I'm looking at. So if I have a price target at $11 with the stock currently at $10, I would try to find the calls that have the most percentage difference between the next strike over without being crazy out of the money.
For what price to execute at, what I essentially do is look at other contracts to determine what the cheapest extrinsic value across the contracts is. Extrinsic value is the extra price above the difference between strike and stock price (the intrinsic value). If the extrinsic value on a contract is much higher than other contracts, you're likely over-paying and want to bid lower. The opposite goes for if you're selling.
Updated 2015: All of this same logic I've built into my Tech Trader system which has been automatically picking out the best strikes for me on numerous trades as well as how to price your order. You can see that it automatically looks down the option chain to estimate the gain on the current contract if certain moves happen in the stock (excluding time decay of course; this is for short-term trades). It then uses intrinsic and extrinsic values across surrounding contracts to decide how to price the current contract.
Options Straddles (ex. Volatile Markets During 2011)
This is another approach you can take if the markets are volatile or you know for sure of a pending event for a stock. What you can do is buy both calls and puts (equal dollar amounts) to just bet the stock will move a lot in either direction. This is called a straddle. Basically you can lose 100% on one side but you count on the other going >100%. The breakeven price when you do a straddle would be the sum of the two breakeven prices for each the calls and the puts.
For 2011, I mainly did this on SPY and FAS, depending on where I think the focus will be (read the news); SPY is general market while FAS leans toward financials. The market at that time would often jump several percent overnight up or down based on any hint of good or bad news on Greece. The same occurred in later years for Fed announcements 2013-2014 and then going into OPEC's announcement on oil in Nov. 2014. You'd think these events would be priced into the options, but for whatever reason, the events often exceed the market's expectations.
You can also try combining this with technicals to find inflection points (bollinger band pinches, etc), but you have to pay attention to ongoing news/events to have a sense of whether it's a good time for this. This is an example of a strategy I was using in 2011 when everyone thought Greece would drag the world into financial crisis:
- Check 30-min bollinger bands for pinch to see what days will gap. (last few weeks, it's pinched mid/end day and then gapped that night).
- Buy equal positions (in dollars, not contracts) on ITM calls/puts at end of day because decay eats up a lot during sideways movement intraday.
- Sell gaining position next morning, often at about 10:30-10:45am EST. After 11am EST, market usually retraces or trades sideways until ~3pm EST, so this can be an opp to let go of the losing side of the straddle.
(Notice the bollinger bands pinch on exactly the days there will be gaps, whether up or down.)
Reading Options Volume
Besides just using options to leverage directional trades on the stock, you can use options activity as another layer of analysis to determine where the underlying stock is going. Some call this reading options volume or orderflow. I learned this primarily while being part of the community of traders at HotStockMarket.com in 2009-2012. One member o7 (aka OptionRunners or Karim) was particularly good at this technique; a big thanks for his help at the time.
The key is to filter out options trades that are just hedges or part of a larger spread, straddle, or other combination, as well as only pay attention to actual opening of calls or puts (as opposed to selling). You can do this manually by watching the options chain for increases in volume coupled with upticks in price; usually trades that force open interest to increase are a good sign. You can also subscribe to services like LiveVol which will have a live database available to query and drill down on particular trades with.
Because of how many more ways you can trade the underlying stock from, it is much more difficult to read the stock this way and takes a lot of practice (as well as keeping in tune with what traders are generally doing around options). For those starting out, I highly recommend following a few traders who do this (such as OptionRunners which you can Google) to get a feel for it.
4410 unique view(s)


