pftq's Stocks and Investing

Trading Guide

Tech Trader

        Welcome to pftq's Stock and Investing page! Below is a basic stock trading guide that should get you off the ground if you're new. On the side, you'll find Tech Trader, a fully autonomous program I built that has been trading live with no human intervention since 2012. This site remains in constant development, but I hope you find what's here so far useful.  Smiley
- pftq
[Expand]

Latest on The Tech Trader Wall

Tech Trader (Mar-13 6:33am): Covered $SWK (-3%).
26% long by 0% short. 15% long Consumer Discretionary, 7% long Technology. See current positions.
Tech Trader (Mar-11 1:01pm): Bought $CPRT.
25% long by 4% short. 11% long Consumer Discretionary, 7% long Technology. See current positions.
Tech Trader (Mar-11 6:42am): Bought $JD.
22% long by 4% short. 7% long Consumer Discretionary, 7% long Technology. See current positions.
See More...

Trading Guide

July 23rd, 2011 PST
Posted by pftq

1. Introduction

     The style of trading I use is what most people call Swing Trading (buying/selling same stock in a week) or Day Trading (buy and sell in a few days).  The method I use for reading a stock is primarily Technical Analysis, but what I look for more than anything else in a stock is trying to understand what other market participants are thinking based on price and volume.

     A lot of people who use mainly Fundamental Analysis for reading a stock will tend to say that Technical Analysis is illegitimate and those who use mainly Technical Analysis would say the same vice versa.  In my opinion, both are valid depending on the timespan you are looking at.  Fundamental Analysis, which is comprised of actually looking at the company structure/data, will tell you how a stock does in several years or more.  Technical Analysis, which is comprised of looking at how much of a stock is being bought/sold, will tell you how a stock will do in the coming year, month, week, or even the next few days - depending the time frame you look at.

     Clearly, fundamentals ought to be what drives a stock, but if no one cares for the company or what it's doing, the price will not move accordingly.  Likewise, if the company becomes very popular and "hyped", people may storm to buy a stock regardless of its fundamentals.  Despite what a stock ought to represent, you have to remember that it is people who set the prices.  In a sense, what you're trying to do is read the "people" who buy/sell the stocks, since they are the ones who ultimately determine the price.

     The guide I am writing here mainly reflects what has worked for me in my own experiences.  My expanations may not always formally correct, but the idea or perspective on stocks is what I consider the easiest way to picture it when I do my own trading.  If you are already set on one trading style above all (or worse yet, already know how to trade), you'd best move on as there will not be anything useful here for you.  The target audiences I originally wrote this for were friends whom I was teaching to trade for the first time, but I decided to make it available to anyone who just wants to learn as well.
9023 unique view(s)
July 23rd, 2011 PST
Posted by pftq

2. Getting Started

     Probably the most common thing said about what to do before trading is to read, read, and read.  At the same time though, trading stocks is something that requires practice and experience above all else.  My overall stance would be to read to get started but ultimately you learn the bulk of it from doing.

     Some books I recommend reading, as well as discussion boards to follow and learn from other traders, are listed on in the resources page at the end of this guide, but again, trading is a very hands-on skill that you probably won't really learn until you actually do it.

Choosing a Broker

     That said, before you begin trading, you'll probably want to set up a brokerage account.  Because it is very hard to upgrade existing accounts, make sure you request all privileges early on (options, forex, etc).  To get options and other trading privileges, make sure to only say you only want speculation with your investments; the broker basically wants to see you don't need the money you are trading.

     There are plenty of decent brokers out there - many advocate Interactive Brokers for cheaper commissions while still having a lot of features.  I personally use TDAmeritrade, only because it was the first broker I used and the tools were sufficient.  There is also an API, which you can easily get access to if you trade more than a handful of times each month or have $25k in funds (the former is easier obviously).  That will be the perspective of this guide, but other brokers should be analogous in tools and functionality.  While there are some very cheap brokers out there, I'd be careful with going too cheap as you still want decent screeners, charts, and execution.  You might find that your commissions are low, but your orders get front-run or lag to market.

     The specific chart-streaming platform I'll be using in the following pages is Command Center 2.0.  You can find it in TDA by going to Tools or going to Home > My Profile and setting it as the tool that starts up when you first login.  At the time of this post, TDA appears to have only made it accessible if you enable it via My Profile so you may not find it under Tools.

How Trading Works

     The main thing to understand is you are basically bidding and selling stocks (shares of ownership in a company) to other people.  When you see the price of a stock, that is the last price a buyer and seller recently agreed on (bid = ask).  When you see the bid vs ask prices, those are what buyers and sellers are still holding out for, waiting for someone to meet their price.

     When you want a stock to move up, you usually hoping for people to buy at the ask price, that is people want the stock enough that they're willing to pay for what the seller asks for it (and sometimes more).  Likewise, a stock is more likely to go down if sellers are constantly selling at the bid price; think of it as the seller not caring anymore and just willing to get out of the stock at no matter how cheap the price.

Settlement Times of Cash
    
     One thing to understand is that you often have to wait about 3 business days after you buy a stock before you can sell and use the money to buy another stock.  The reason is despite most trades being electronic nowadays, it takes time for the money and stock ownership to actually transfer.

     For example, if you buy XYZ on Monday and sell Tuesday, you won't get your money until Monday + 3 days = Thursday.  If you buy XYZ on Monday and sell on Thursday, you get the money the instant you sell.

     Most brokerages will allow you to sell a stock before the two days are up, but you just won't get to spend the money until after the two days.  Selling within the same day is called "Daytrading" and is usually disallowed unless you have a Margin account (more details below).  Some firms, like TDA, will let you sell in the same day just a few times times a week, presumably for maybe if you make a really bad decision and need to sell immediately.

     If you have $25000 or more, you can apply for what is called a "Margin Account".  This lets you use the money from selling a stock without waiting two days after the buy-date.  However, you are actually borrowing from the broker to make up for the time until your own money actually settles (after 3 days).  The catch here is that you pay interest for time you using the borrowed money.  You would normally only do this if you are sure the stock you buy can give you more gain than the interest would cost you.

Trading Virtually for More Practice

     While I personally started off trading with an actual brokerage account, I would recommend trading virtually as well for practice.  If anything, you can trade virtually while waiting for money to settle in the 3-day period or for riskier stocks you aren't sure of, just to get better at predicting stocks for your real account.

     One thing to note about virtual trading, however, is that it cannot simulate fill and slippage - that is, whether or not there are actually sellers to buy from or buyers to sell from.  Try not to get into the habit of buying stocks with too little volume because with a real portfolio, there might not be enough people wanting to buy your shares for you to get out (without causing the price to fall).
8889 unique view(s)
July 23rd, 2011 PST
Posted by pftq

3. Reading a Stock

     First off, there are plenty of other things not covered below to watch for.  You can probably read about them and the below indicators in more depth through books on technical analysis, candlestick patterns, etc.  Over time, however, I've found I relied most heavily on a few select indicators, so that will be my focus.

     When you open up Command Center, the most useful thing is obviously the Chart.  Try to match the settings in the  screenshot below.  You can change the Time Period and Frequency to match how far ahead you want to predict.  For example: daily = next couple days, 30-min = next couple 30 minutes, etc.

     The line type can be changed between line and candlesticks; I use both equally.  A candlestick basically lets you see the max/min price of that day as well (the body being the open/close).  RSI is also very useful for minute-to-minute chart reading, and I usually switch it with Slow-Sto to avoid making the chart too crowded with another indicator added.


(Ironically, the stock shown above is an example of a *bad* one, which has broken support.)

Here's a quick guide:
- STO lines crossing upwards = Going up in the very next cycle (relative to the chart frequency, ex: daily = next few days)
- MACD lines crossing upwards = Overall go up in the next few cycles.  For example, STO might say it'll go up in the immediate cycle but it might only go up for a tiny bit before dying if the MACD is pointed downwards.
- RSI > 70 = Too high, should come down soon, but only enough that RSI is back under 70, not that the stock itself should start plummeting (although it can).
- Volume = how many trades are being done.  More = stronger movement (up or down).  A stock is useless even if it goes 1000% if there's only 1 guy buying it.  When a stock is moving up, you want it to do so on high volume.  If there is high volume but no price movement, it is also not a good sign, as that has to make you wonder how much more buying it'd take to finally move the price.  This is arguably the most important indicator; it can basically substantiate or de-emphasize any price movement.

Trendlines

     Trendlines are covered in basically any tech analysis book, but I just want to re-emphasize how important they are.  Draw them.  Draw them across the bottoms when a stock is going up to figure out where the support is, and draw them across the tops when a stock is going down to see where the resistance is.  The time frame across which you draw them is what time frame they will be good for predicting.

      The stock price is constantly fluctuating, but you want to know when the movement is just "normal" fluctuation on the way up or something more drastic.  A support line is basically where the price should never fall below, if the stock is following that current trend.  A resistance line is where the price should never go above, again if the stock is following the current trend.  If the stock price crosses significantly below a support line or above a resistance line (called a "break"), it means the stock no longer follows that immediate trendline.

     When a trendline is broken, enlarge the time frame to see more of the graph and draw an additional trendline on the longer time span to see where the stock price might stop next.  You're basically now counting on the longer term trendline once the shorter term is broken.  Conceptually, it makes sense: A trendline that lasts only a few minutes will likely be broken within minutes while the longer ones (days, months, years) will be stronger.

     Another thing to note is that when trendlines break,  the old trendline now switches from support to resistance or resistance to support.  For example, if it took a lot of buying power to break past a resistance line at $50, it will also take a lot of selling to bring it back under.

     Below is an image of JCOF during the Spring of 2011.  You can see that drawing a trendline across the bottoms for the month would have clearly told you when to buy the stock so as to not get in too high (and breaking of the support line would mean to get out as the stock might continue to go lower in that time frame).


     You can see the below image for how even across a couple days can be meaningful:


     The crossing of the support (bottom) and resistance (upper) meant that that point was most important to watch to see if it would break upwards or downwards (one of the lines had to be wrong).

     And below is an image of LVLT in 2011, using a combination of trendlines and STO crosses.  LVLT, in my opinion, is probably what you want most stocks you buy to look like - that is, it resembles a stair-like pattern.


     You can see that each time the green, short-term support lines broke, the chart falls back to using the blue longer-term trendline.  Each time the red, short-term resistance lines broke, it usually meant the stock was done coming back down.

     It seems silly to draw lines that only work if the stock is following the line, but that's the idea.  If a stock is moving up and bouncing off its support line during each fluctuation, you can determine when the stock has finished moving up if at a certain pullback, it falls below the support line.  Likewise for a stock currently headed downwards - it is probably done heading downwards if it suddenly crosses above its resistance line.  Think of it as a rule of thumb for making consistent decisions on whether a stock is heading up or down.

     Below is a chart of SPY showing if you traded just trendline breaks over the last 20 years using Tech Trader:

Closing Words

      The most important part (and a reason so many lose in stocks) is to be consistent and have discipline.  Don't make a stretch and try to convince yourself of something that the chart doesn't show.  If a stock is good, the chart itself will be convincing.  

     Furthermore, don't try to predict what indicators might do - the indicators themselves are supposed to do the predicting.  Anything else that isn't listed above is ambiguous so don't try to jump the gun by saying it's "about to cross" because it might not.  It's when you try to go against the indicators (or jump the gun and guess) to get the extra percentage that you risk a lot.

     Also make sure you remember what time frame you are reading a chart for.  Some of the mistakes I've regretted most, for example, were using a 30-min frequency chart and not getting out of the stock in the next couple hours (2-3 x 30-min) when the indicators were still good.  If you are reading a chart for 30-min, it's only good for the next several 30-min periods (hours).  If you reading a chart for day-to-day, it is only good for the next several days.

     And last but not least, not all stocks will be as "readable" as others.  Stay away from those that are less predictable (constantly breaking trendlines, etc).  There are plenty of readable stocks out there - why take the extra risk?
8762 unique view(s)
July 23rd, 2011 PST
Posted by pftq

4. Finding Stocks

     Right now, if you were given a stock symbol and its chart, you should be able to get an idea of whether or not you want to buy it - but how do you get the stock to read in the first place?

     What you want to use is what's called a stock screener.  You can think of it as a search engine for stocks.  The criteria you set can range from the mere exchange the stock trades on (NYSE, NASDAQ, AMEX, etc) to the price and volume of a stock at any given time frame.  From here, you should be able to realize that all the indicators you learned previously can just be plugged into the screener and the matching stocks returned.

Again, using TD Ameritrade, the stock screener can be found by going to:
     Research > Stock Screeners

     This is one of the areas TDA probably shines best, in my opinion.  The criteria you can search by is just about anything you've learned.  Hovering over the symbol names in the results list will also give you a preview of the stock's chart, making it easy to skim through entire lists of stocks in one go.

     The main challenge here is that you want to strike a balance between filtering and returning too many stocks.  While you can plug in the criteria for the "perfect" stock in your mind, very rarely will there be a stock that matches these ideal characteristics.  The best way to go about it is to just play around with the settings until you find a setup you can use consistently - then save it to reuse again and again.

The below, for example, is one I use to watch for potential breakouts:
- Price Change = +5% in last trading session
- Volume vs Average = Very Heavy
- Volume Range > 1,000,000
- Current Price between $.001 and $10 (too high and you wait months for 5%)

     Just remember that you want to find stocks that have a history of following the patterns and indicators you learned.  There will be a lot of stocks that are entirely unpredictable, but again, why take the risk when you can get consistent profit predicting nicer stocks?


(Ideally what you want your stocks to look like)
8465 unique view(s)
July 23rd, 2011 PST
Posted by pftq

5. Buying and Selling

     Once you have found a stock and determined it's worth investing in or not, you have to buy it.  More importantly, once you buy in, you eventually have to sell - otherwise you only have the stock and not the money.  It seems like buying and selling should be the easy part but the choices available in the process, as well as the timing of buying and selling itself, can make it perhaps a frantic process (but don't get frantic yourself).

Definitions:
- Market Order = buy or sell at the ask/bid.  Fastest but can be costly if the ask is high or bid low.
- Limit Order = set a bid to buy or ask to sell.  This is what you should normally use.  You basically wait for someone else to meet your price request or better, so it takes time but is cheaper for you.  Usually you want to set the limit a few percentages above your ideal buy price so that you at least you get into the stock if you're a tiny bit off (and reverse for selling).
- Stop Market/Limit = A "stop" basically means, don't put this order out until the price gets to this point.  It's more automation so you don't have to sit the whole 7 hours but can be dangerous if something unexpected happens and you automatically buy/sell.  I only use it to auto-sell if the stock drops too much when I'm not around.
- Trailing Stop = Same as a stop except you can set a percentage change.

     As stated earlier, the only way a trade can occur is if a buyer and seller agrees on the same price - that is, you buy at someone else's ask or sell to someone else's bid.  You should be able to predict the price movement via chart reading to know if you might get a better price to buy/sell by waiting.  The other thing you might want to look at are Level 2 Quotes.

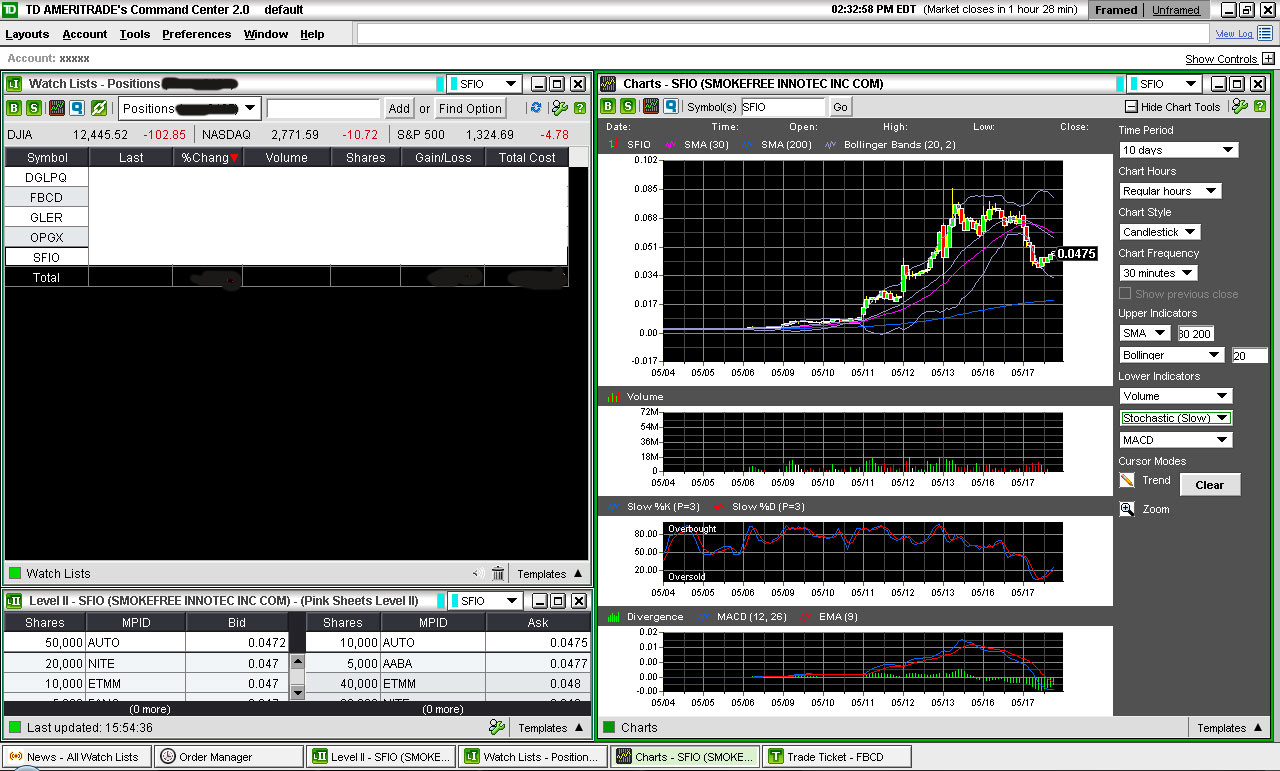
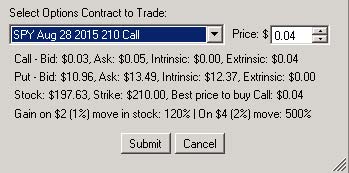
Level 2 Quotes

     Seeing level 2 quotes might cost money depending on your broker.  For TD Ameritrade, it costs monthly but is free if you trade frequently (about 10 or so a month so not that hard to reach).  To access it in TDA, Command Center has an option under Tools > Level 2.  Notice the lower left here from an earlier screenshot:


     Level 2 quotes are basically bid and ask price "lists".  Previously, if you saw bid vs ask, you only saw the immediate bid or ask.  With level 2, think of it as being able to see even further down the line, the next bid or ask, to all the orders currently out.  This means if a bunch of people have a limit order to sell at $10 while the stock is at $8, you will see their "ask" price further down the line after the guys wanting to sell at $8.06, $8.10, $9, etc.

     This might sound like an incredibly useful advantage, but keep in mind that the level 2 only represents the orders out "at the moment."  Think of it this way - even if you plan to buy a stock eventually, do you actually go out and put in the order for the stock  immediately or do you wait a bit, perhaps for for the price to drop? Most people wait.  So while it may look like no one is wanting to sell or buy (thin ask/bid), someone can suddenly decide to put an order for a million shares at any given moment.  The other issue is that not all orders are always visible on Level 2 - that is, even though someone put an order in, it might not always show up.

     Level 2 then is useful to an extent - perhaps to see what is going on currently or to see how much it would take to "break" through a price level.  For example, if there were only 1000 shares being sold at $80 (1000 shares at ask for $80) and 500 being sold at $81, then someone can put an order for 1500 shares at $81 to buy out all the orders set at $80-81.  If no one else decides to sell in the 80-81 range, the next person who buys would have to pay higher.  The same goes for selling into the bid, but again, remember this is if everything were held constant and no one decided to put in additional orders.

Timing of the Day/Week

     I mentioned earlier that timing is important.  This applies to reading the chart to see if the price might come down more to buy or go up more to sell, but it also applies to the time of the week and time of day itself as well.  It seems silly, but remember here that the market works by having people buy and sell.  When and how these people buy and sell most definitely affect the stock.

     The main tendancies I've noticed are:
     - Stocks are usually sell off (price goes down) on Fridays.  Think of it as people not wanting to worry about the stock over the weekend.
     - The most active times of day are the first hour and a half (9:30-11am EST) and last hour of the day (3-4pm EST).  It doesn't necessarily mean the price will go up, but the most significant price movement usually occurs during these times.
     - The "middle" of the trading day (11am-2pm EST) is the least active and where stocks tend to dip or at least slow down if they're rallying.  Think of it as people having to go to work or get lunch.  I would avoid selling during these times unless the stock absolutely dies, as the price will probably be better later.

     Of course, this doesn't always happen and perhaps the psychology of investors might change over time so this is no longer true, but this is a trend I've noticed in the past two years.  If a stock, for example, ends up rallying on a Friday, it only makes the stock even more attractive as clearly the general tendency to sell off did not affect it.

     One way to put this to use is to buy at the end of the day and sell in the next morning or afternoon.  This is not a bad idea at all, and some traders only do this as it can be a consistent to way to trade.  You might miss out if the stock happens to move up a lot during the less active middle of the trading day, but you don't run the risk of losing as much if it dies instead.  It's worth considering if you want to play it safe or are unsure of a stock.

Other Things to Keep in Mind

Buy in Portions:
     If unsure, don't buy all the shares you want at once.  Perhaps it'll dip so you can buy more later at a cheaper price.  Some call this "averaging down."  The thing I warn against however is to know when you're buying more into a rising a stock on pullback and not buying into a stock that's actually dying.

Sell in Portions:
     Similar to buying in portions above.  The other thing to add though is that if you own too many shares (particularly in cheaper stocks), selling everything at once might scare everyone else into not buying or selling their shares as well, thus driving down the price before you might fully get out.  Just think of your own reaction if you saw suddenly on Level 2 that someone put in an order to sell at a huge amount.  This is less of an issue (if at all) for larger stocks >$5.

Sell Some Before the News:
     A lot of stocks you find will be driven primarily by upcoming news.  If you happen find yourself in such a situation, keep in mind that many will be expecting to cash out once news is released.  If everyone sells simultaneously, the price drops.  Again, this is less of a problem for larger stocks (>$5), but it still helps to sell in parts on the way up so it's easier to get out in case the price does fall after news.

Cutting Losses, Failed Expectations:
     One of the harder things to do is to admit you've made a mistake and just need to take the loss or breakeven.  A lot of beginner traders often decide they are suddenly longterm investors when their stock dies or doesn't meet their expectation.  Don't fall for it.  If support lines break and the next one is much further down (or worse, doesn't exist), get out immediately.  If you expected the price to go up by tomorrow and it doesn't, move on.

Don't Panic:
     The Hitchhiker's Guide to the Galaxy is very applicable here.  If the price starts falling, don't hit the sell button on impulse.  This might seem contradictory to "Cutting Losses", but the point here is to make sure the stock is actually dying and not just pulling back.  Check your support lines, check the STO, check RSI.  If lines aren't broken, then you probably are reacting emotionally.  If you want to calm your nerves, then sell a portion of your position (so you don't miss out if the stock ends up going higher later).

     A lot of the advice seems to flip back and forth, but they apply to different scenarios.  The hard part of learning to trade is to recognize what's going on at the current moment.  On reflection, it'll be easy to realize what you should have done, what was actually occuring.  Use that to build your experience.
8615 unique view(s)
December 2nd, 2011 PST
Posted by pftq

6. Options, Straddles

     Options magnify both your gains and losses, but your losses are floored at 100% (opposite, as usual, if you're shorting).  However, you're now betting not just on the stock price but on people's bias/perception on the stock as well.  That is, even if the stock goes up, your options might actually fall if the expected potential movement of the stock goes down from when you bought it (you weren't the only one expecting the stock to go up that amount).  There's a lot you can do with this; what I mainly do and what I'll cover here is making a directional bet on the underlying stock.

     The key for me with options is to bet small.  Since your gains are magnified, you make a lot when you're right.  When you're wrong, you lose a huge percentage (basically everything) but the actual dollar amount is small if you only put little to begin with.  Unless you're very certain or are going for some kind of straddle/strangle, try to buy contracts that expire several months down the line or more, to minimize decay.

    The price of an option to me is mainly made up of three components, which I consider expiration value, time value, and uncertainty (volatility) value.  The terms are not necessarily correct, just the easiest way for me to think of them from my own experience (I've never read any books on this).  The expiration value is the value of an option on expiration day and the minimum value of the option after the decay of the other two.  It is the difference between the strike and the actual stock price; if it's a call, your strike must be lower and vice versa for a put.  The other two, time and uncertainty, are additions on top of the expiration value.  It is the reason why a call with the strike at the current price is not zero.  The time value is based the number of days left before expiration.  The uncertainty value is the component that can vary; it is the part where people's expectations play in.  If people expect a stock to go down, the puts might be much more expensive than the calls for the same difference from strike (put/call skew).  This is often the case during market sell offs or going into major news events.

     The price of an option on expiration day will always be the difference between the stock price and strike, so if you pay more than that difference, it means you are betting that the stock will move enough by expiration day to increase the difference (options price).  For example, if you pay $1 for a call at strike $10 for a stock that's already at $10, it means you're betting the stock will be at least $11 by expiration.  $11 is just your break-even price, since the difference between stock and strike (the ultimate price on expiration day) will be $1 , which is what you paid.  You can also interpret the current price of an option to be what other people think the stock might go to.  A call that has a strike above the stock price is out of the money while below the stock price is in the money; the opposite goes for puts where you're betting the stock goes down.

In other words, the formula for determining your break-even price on expiration day is:
Breakeven Price of Call = option price + strike
Breakeven Price of Put = strike - option price

The amount you're betting the stock to move is:
Expected move in stock = breakeven price - stock price

     For me, as I'm a directional trader mainly basing decisions off the underlying stock, I generally only trade options when the break-even price for an option is well within my target price for the stock.  It lets me not worry about decay because I can expect the minimum value of the option (assuming my target for the stock is right) will be profitable.  If my stock target is hit early enough that there's still extra value from time or uncertainty, then that's just an added bonus.

Picking Strikes, Expected Gains, and Prices

     For myself, I have my own way of picking what strikes I want.  For longer-term trades, I try to stay near the money to minimize time decay, but if I am expecting a large move on the stock in a couple days, I can gauge what strikes would give me the best return for that move in the stock.  Generally, the more out of the money the option is, the more leverage you get over the return.  To figure out how much, I look at the next strike over that's deeper in the money.  If the next strike over is $1 away and 50% more, then I'd expect a $1 move in the stock to lead to about a 50% move in the options at the strike I'm looking at.  So if I have a price target at $11 with the stock currently at $10, I would try to find the calls that have the most percentage difference between the next strike over without being crazy out of the money.

     For what price to execute at, what I essentially do is look at other contracts to determine what the cheapest extrinsic value across the contracts is.  Extrinsic value is the extra price above the difference between strike and stock price (the intrinsic value).  If the extrinsic value on a contract is much higher than other contracts, you're likely over-paying and want to bid lower.  The opposite goes for if you're selling.

     Updated 2015: All of this same logic I've built into my Tech Trader system which has been automatically picking out the best strikes for me on numerous trades as well as how to price your order.  You can see that it automatically looks down the option chain to estimate the gain on the current contract if certain moves happen in the stock (excluding time decay of course; this is for short-term trades).  It then uses intrinsic and extrinsic values across surrounding contracts to decide how to price the current contract.


Options Straddles (ex. Volatile Markets During 2011)

     This is another approach you can take if the markets are volatile or you know for sure of a pending event for a stock.  What you can do is buy both calls and puts (equal dollar amounts) to just bet the stock will move a lot in either direction.  This is called a straddle.  Basically you can lose 100% on one side but you count on the other going >100%.  The breakeven price when you do a straddle would be the sum of the two breakeven prices for each the calls and the puts.

     For 2011, I mainly did this on SPY and FAS, depending on where I think the focus will be (read the news); SPY is general market while FAS leans toward financials.  The market at that time would often jump several percent overnight up or down based on any hint of good or bad news on Greece.  The same occurred in later years for Fed announcements 2013-2014 and then going into OPEC's announcement on oil in Nov. 2014.  You'd think these events would be priced into the options, but for whatever reason, the events often exceed the market's expectations.

You can also try combining this with technicals to find inflection points (bollinger band pinches, etc), but you have to pay attention to ongoing news/events to have a sense of whether it's a good time for this.  This is an example of a strategy I was using in 2011 when everyone thought Greece would drag the world into financial crisis:
- Check 30-min bollinger bands for pinch to see what days will gap. (last few weeks, it's pinched mid/end day and then gapped that night).
- Buy equal positions (in dollars, not contracts) on ITM calls/puts at end of day because decay eats up a lot during sideways movement intraday.
- Sell gaining position next morning, often at about 10:30-10:45am EST.  After 11am EST, market usually retraces or trades sideways until ~3pm EST, so this can be an opp to let go of the losing side of the straddle.


(Notice the bollinger bands pinch on exactly the days there will be gaps, whether up or down.)

Reading Options Volume

    Besides just using options to leverage directional trades on the stock, you can use options activity as another layer of analysis to determine where the underlying stock is going.  Some call this reading options volume or orderflow.  I learned this primarily while being part of the community of traders at HotStockMarket.com in 2009-2012.  One member o7 (aka OptionRunners or Karim) was particularly good at this technique; a big thanks for his help at the time.

     The key is to filter out options trades that are just hedges or part of a larger spread, straddle, or other combination, as well as only pay attention to actual opening of calls or puts (as opposed to selling).  You can do this manually by watching the options chain for increases in volume coupled with upticks in price; usually trades that force open interest to increase are a good sign.  You can also subscribe to services like LiveVol which will have a live database available to query and drill down on particular trades with.

     Because of how many more ways you can trade the underlying stock from, it is much more difficult to read the stock this way and takes a lot of practice (as well as keeping in tune with what traders are generally doing around options).  For those starting out, I highly recommend following a few traders  who do this (such as OptionRunners which you can Google) to get a feel for it.
3933 unique view(s)
June 18th, 2009 PST
Posted by pftq

x. Links and Resources

     Much of my trading just came from experience, so it's difficult for me to really recommend any resources.  Much of it simply came out of searching online and following the community.  My recommendation would be to just join a community and learn with others, as opposed to trying to learn to ride a bike from a book.  The texts I do list below are more for context of what's been going on rather than necessarily being related to how to trade itself.

Reading and Learning
  • Dark Pools by Scott Patterson - Recent book describing exactly a lot of the psychological premises behind Technical Analysis and really just the truth about how the modern stock market came to be (effectively coded by one guy). Also nice confirmation from historical accounts in the industry about how large funds really do trade on psychology/technical signals rather than fundamental analysis as schools would have you believe.  A summary of the history covered for the Island bit can also be found at Wired just to give you a taste of what the text is really about.
  • What are the Different Types of Quantitative Analysts? - Summary of industry levels in quant and algorithmic trading, so you know who is out there and doing the real stuff, where the talent is.  And so you can fact check the next time anyone claims to be a "quant" trading from home.
  • HFT Industry Makes Less in a Year Than JP Morgan Does in a Quarter - Article highlighting how little high frequency trading actually makes for the massive operational risk and overhead they undertake and why it's so overrated.
  • The Power of Fate and Irony - Less on trading specifically but for the superstitious, I personally do intentionally sell out of positions that I want to go up in order to "jinx myself" (by regretting having sold).

Community Sites
  • Hot Stock Market Financial Message Boards - Forum discussing the stocks.  Good for reading about what others think and have researched.
  • Stock to Buy Discussion Forum - Smaller discussion site and blog; also good for seeing what others are thinking about.
  • Hot Penny Stocks Finder - Public chatroom and board on various stocks (not just penny stocks).  Useful for seeing what stocks are popular.
  • OptionRunners - Very successful options trader worth following and learning from.  IMO the best trader I know of who's actually trading for a living and not just talking / writing about it.
  • StockTwits - Twitter for stock traders; useful for gauging what people are thinking about a stock.

Tools and Information
3891 unique view(s)