A couple weeks ago, I posted about a potential inverse H&S on FAS working a right shoulder for the holiday season.
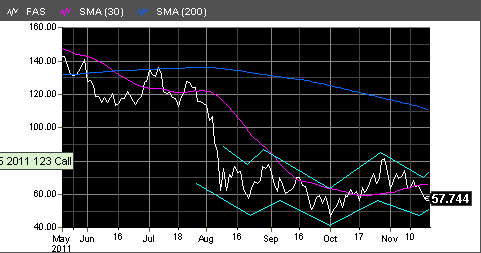
Kind've forgot about it in the course of things but it seems like we're dipping just enough to get that right shoulder right now. This means nothing if we break down further and ruin it, but it's interesting to see if we do confirm it (and thus get the EOY rally so many seem to expect, followed by a breakdown in 2012).
Here's an updated chart:
Right now, I'm in another SPY straddle in at 122, slightly weighted toward the long side.
Nice bounce today, almost 200 points on DOW. I'm expecting we'll see another day or two of continuation before coming back down again.
Going into December, I'm mainly watching this inverse H&S formation on FAS. I realize FAS is not a market indicator, but I notice that it's generally been easier for me to gauge the market using it. Maybe it smoothes out some of the more extreme fluctuations or something.
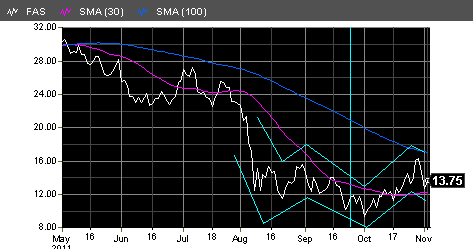
^Basically what I said about a couple more days or so of uptrend, then a pullback further for the right inverse shoulder (the 3rd dip in the W) before we go up more strongly.
For the longer term, I'm still thinking we'll be up overall in Q4 before we seriously head down in 2012. If the chart above holds the next few weeks, it should confirm that.
Edit: Just keeping an eye on currencies here - we might go into that third dip sooner without more uptrend, so I'd watch for an entry on the short side rather than try to time the bounce.



 But PEP did awesome so oh well ).